Intro
eBPF (extended Berkeley Packet Filter) is a Linux kernel technology that allows verified programs to run safely inside the kernel. These programs can be attached to system calls, network events, security checks, or performance counters, making it possible to observe and enforce policies with low overhead. Unlike traditional kernel modules, eBPF programs are verified before execution, which improves safety and reduces the risk of crashes. Today, eBPF is widely used in observability, networking, and security, forming the foundation of many modern Linux tools.
You’ll find my entire project here: https://github.com/Enz0L/eBPFSecMonitoring
Why eBPF?
Safe by design: an eBPF verifier checks every program before it runs. No memory corruption, no infinite loops, no kernel panics.
Dynamic: you can load and unload eBPF programs at runtime, without rebooting or recompiling the kernel.
Portable: instead of poking fragile kernel internals, eBPF uses stable hooks (tracepoints, helpers) that work across kernel versions.
Low overhead: because the program runs right where the event happens, you avoid the overhead of context switches or system-wide tracing.
What can you do with it?
You can use it for: security monitoring or observability, for example measure how long a function call takes, track which files are being opened, or profile CPU usage in real time. You can also use it for networking monitoring or for perf tuning: Get fine-grained metrics on I/O, memory…
eBPF presentation
In my case, I used a Python library with C code in order to do an eBPF program. It was the easiest way I found in order to make a quick POC.
How eBPF works
An eBPF program is written in restricted C (or directly as bytecode), there isn’t arbitrary pointers, no infinite loops, no syscalls: the code is limited to safe data collection and transformations.
Verification by the verifier
Before the kernel accepts the program, it runs it through the eBPF verifier.
Attaching to a hook
An eBPF program doesn’t run by itself. It must be attached to a kernel hook:
Tracepoints: stable kernel events (e.g., sys_enter_openat, sched_process_exec), Kprobes/Kretprobes: hooks into kernel functions (less stable, more powerful). Sockets / XDP: to filter or manipulate network packets. LSM hooks: for security checks (access control, privilege use). Perf events: CPU profiling, hardware counters.
When the event occurs → the kernel executes the attached eBPF program.
Kernel exec
The eBPF bytecode runs in a small in-kernel virtual machine. On modern kernels, it’s usually JIT-compiled into native CPU instructions → very fast. Programs can call eBPF helpers (APIs exposed by the kernel), such as: “bpf_get_current_pid_tgid”, “bpf_get_current_uid_gid” (process IDs), “bpf_probe_read_user_str”, “bpf_probe_read_kernel” (safe memory reads), Maps (bpf_map_update_elem) to store data, perf_submit to send events to user space.
Communication with user space
eBPF only collects data. Heavy processing happens in user space.
Communication is done via maps or buffers:
BPF_PERF_OUTPUT(events) defines a perf buffer.
The eBPF program writes into it with perf_submit.
A user-space process (Python, Go, C, etc.) continuously reads from the buffer.
That way, filtering, correlation, formatting (JSON), or SIEM export happen outside the kernel.
Let’s code !!!
Global code presentation
Load configuration
1 | cfg = load_config(args.config) |
- Reads YAML config (
config.yaml) for rules: sensitive paths, allow/deny lists, ignored prefixes. It Keeps policy separate from the code for easier updates.
Embed eBPF program (C) inside Python
1 | BPF_PROGRAM = r""" |
- The eBPF code is defined as a raw string. Python passes this source to BCC to compile into eBPF bytecode.
Compile and load into the kernel
1 | from bcc import BPF |
- BCC calls LLVM/Clang to compile the C snippet into eBPF bytecode. The bytecode is loaded into the kernel, verified, and attached to tracepoints.
Register a perf buffer handler
1 | def handle_event(cpu, data, size): |
events is the perf buffer defined in the C code (BPF_PERF_OUTPUT(events);). Each time the kernel sends an event, the Python callback handle_event is triggered. Inside it, we decode PID, PPID, process name, and file path. Apply filtering logic: only alert if the path matches sensitive rules. and then Print the result in JSON format.
Polling loop
1 | while True: |
A blocking loop that continuously waits for events from the kernel. Each event automatically triggers the callback.
Why do we need C (eBPF)?
You cannot do everything from Python because:
- eBPF programs run inside the kernel at the exact moment of the event (e.g., syscall entry). Python runs in user space: it cannot intercept syscalls at kernel level.
- Kernel modules are risky: a bug can crash the whole system. eBPF programs are verified before running:no unbounded loops,no out-of-bounds memory access,limited stack: this makes them safe to run dynamically in the kernel.
Performance and low latency
- eBPF runs directly in the kernel, right where the event happens → minimal overhead. The kernel collects only essential metadata (PID, PPID, filename). Heavy logic (filtering, formatting, alerting) is done in Python, outside the kernel.
Kernel APIs
- Accessing fields like
task_struct->real_parent->tgidor reading syscall arguments requires kernel helpers (bpf_get_current_task,bpf_probe_read_user_str, etc.). - These helpers are only available to eBPF programs.
Communication model
- eBPF sends events through perf buffers or ring buffers, designed for efficient kernel → user communication.
- Python consumes these events safely using BCC bindings.
Division of roles
C (eBPF, kernel space):
- Hooks into syscalls, captures PID, PPID, comm, filename.
- Collects data safely under verifier rules.
- Pushes compact events into a perf buffer.
Python (user space, BCC):
- Loads and attaches the eBPF program.
- Receives events from the buffer.
- Applies filtering, formatting, and alerting.
- Exports results (JSON) to stdout or SIEM pipelines.
Explanation of the eBPF C Code
Includes
1 |
uapi/linux/ptrace.h: exposes types and helpers for tracing programs.linux/sched.h: definesstruct task_struct, used to access process metadata (like the parent PID).
Event Data Structure
1 | struct data_t { |
- Defines the fixed structure sent from kernel to user space.
pid: process ID (tgid), whileppidis parent process ID.comm: short name of the process (16 bytes).filename: file path being opened (bounded buffer of 256 chars).
Perf Buffer
1 | BPF_PERF_OUTPUT(events); |
- Declares a perf buffer map named
events. - This is the channel to send data (
struct data_t) from the kernel to user space.
Getting the real PPID
1 | static __always_inline u32 get_ppid(void) { |
bpf_get_current_task(): pointer to current task_struct.task->real_parent->tgidis the thread group ID of the parent (the PPID).bpf_probe_read_kernel: safe read from kernel memory (mandatory in eBPF).__always_inline: forces inline to reduce stack usage.
Submitting an event
1 | static int submit_evt(void *ctx, const char __user *filename) { |
- Initializes
struct data_t. - Gets PID and PPID.
- Copies process name into
comm. - Reads the
filenamestring argument from user memory. - Submits the event into the perf buffer.
Attaching to tracepoints
1 | TRACEPOINT_PROBE(syscalls, sys_enter_openat) { return submit_evt(args, args->filename); } |
Hooks the eBPF program to tracepoints for syscalls openat and openat2, each time one of these syscalls is entered, submit_evt is called with the syscall arguments and args->filename provides the user-space pointer to the file path string.
–
Python “utility” part
The Python script acts as the user-space controller that: loads and compiles the eBPF program written in C, attaches it to kernel hooks (sys_enter_openat* tracepoints), receives events emitted by the kernel through a perf buffer, applies filters and logic in Python AND finaly: outputs alerts in JSON format.
load_config(path)
1 | def load_config(path): |
It opens a YAML file and parses it into a Python dict.
now_iso()
1 | def now_iso(): |
- Produces the timestamp (could be modified).
main() — program entrypoint
CLI parsing
1 | ap = argparse.ArgumentParser(description="eBPF open monitor (open_sensitive only, vrai PPID)") |
In order to run, it requires --config (path to YAML config). Using argparse gives helpful --config output and input validation.
Load and normalize configuration
1 | cfg = load_config(args.config) |
Reads the open_monitor section then converts lists to sets for O(1) membership tests (allow_comm, deny_comm). It also converts ignore prefixes to a tuple so str.startswith(tuple) can test multiple prefixes in one call.
Compile & load the eBPF program
1 | b = BPF(text=BPF_PROGRAM) |
BPF_PROGRAMis the embedded eBPF C code.- BCC compiles it, loads it into the kernel, and attaches it to tracepoints.
Event callback
1 | def handle_event(cpu, data, size): |
Converts raw event bytes into a Python struct and decodes strings safely and strips NUL padding.
Filtering
1 | if deny_comm and comm in deny_comm: |
- Deny list: drop events from blocked binaries.
- Allow list: if set, only keep whitelisted commands.
- Ignore prefixes: skip paths like
/proc/,/sys/.
Alert emission
1 | if match_any(path, sensitive): |
- Emit JSON only if the path matches a sensitive pattern,
flush=Trueensures immediate output (useful when piping to SIEM/log collectors).
Linux environment check
1 | if __name__ == "__main__": |
- Ensures script runs only on Linux.
Results
When trying to opening sshd_config file:
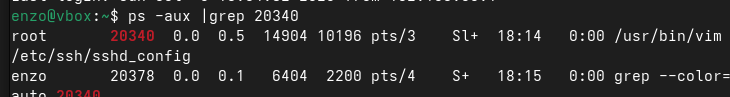
We can see the result here:

We can compare the PID and he is the same.
Carrying out this POC allowed me to get hands-on experience with a tool I had been hearing about for a long time. I discovered a Python library that enabled me to quickly and easily implement a piece of eBPF code.